Remote sensing imagery is a useful, complementary tool within HabWAVE, not only as a “near real time” information source for the cruise, but also and especially for in situ data interpretation. The main sensors analyzed that are able to provide information on internal waves signature are on board ESA’s Sentinel 1 and Sentinel 2 satellites, both part of the ESA/European Commission GMES initiative (Global Monitoring for Environment and Security) and in line with ESA’s Copernicus mission. Each Sentinel mission is composed of twin satellites (A and B), that share the same orbit plane with a 180° orbital phasing difference. With both satellites operating, the repeat cycle for each constellation is 6 days.
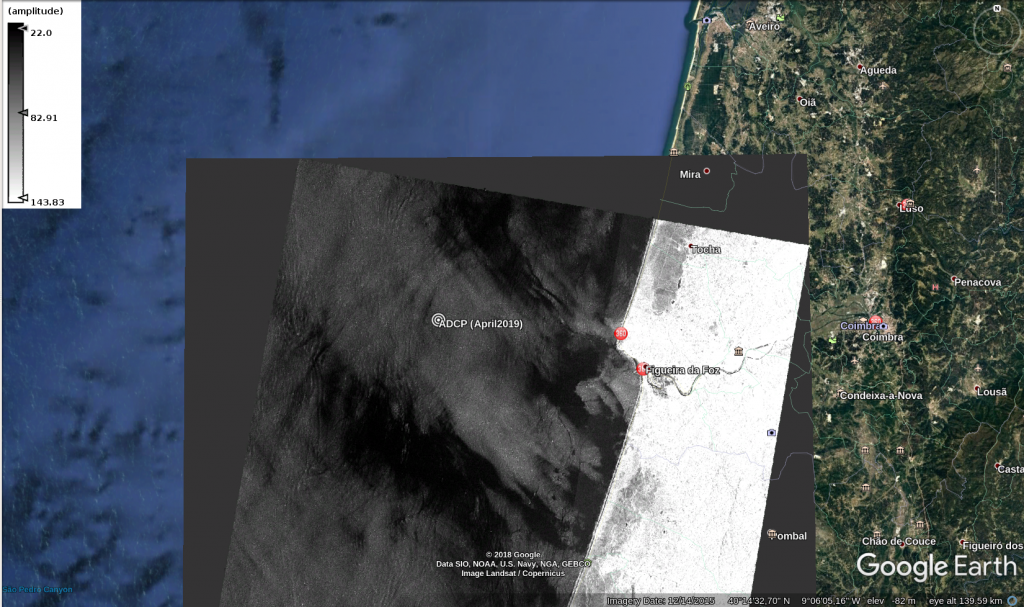
A synthetic aperture radar (SAR) is on board both satellites Sentinel 1. SAR is an active sensor that first transmits microwave signals and then receives back the signals that are reflected, or backscattered, from the Earth’s surface. One of the greatest advantages of this sensor is it is mostly undisturbed by the atmosphere and cloudy conditions. In the case of the ocean, SAR detects among other things the roughness of its surface. Due to convergence and divergence associated with the crest and trough of the internal waves as they propagate, they have a surface signature that can therefore be identified in SAR imagery.
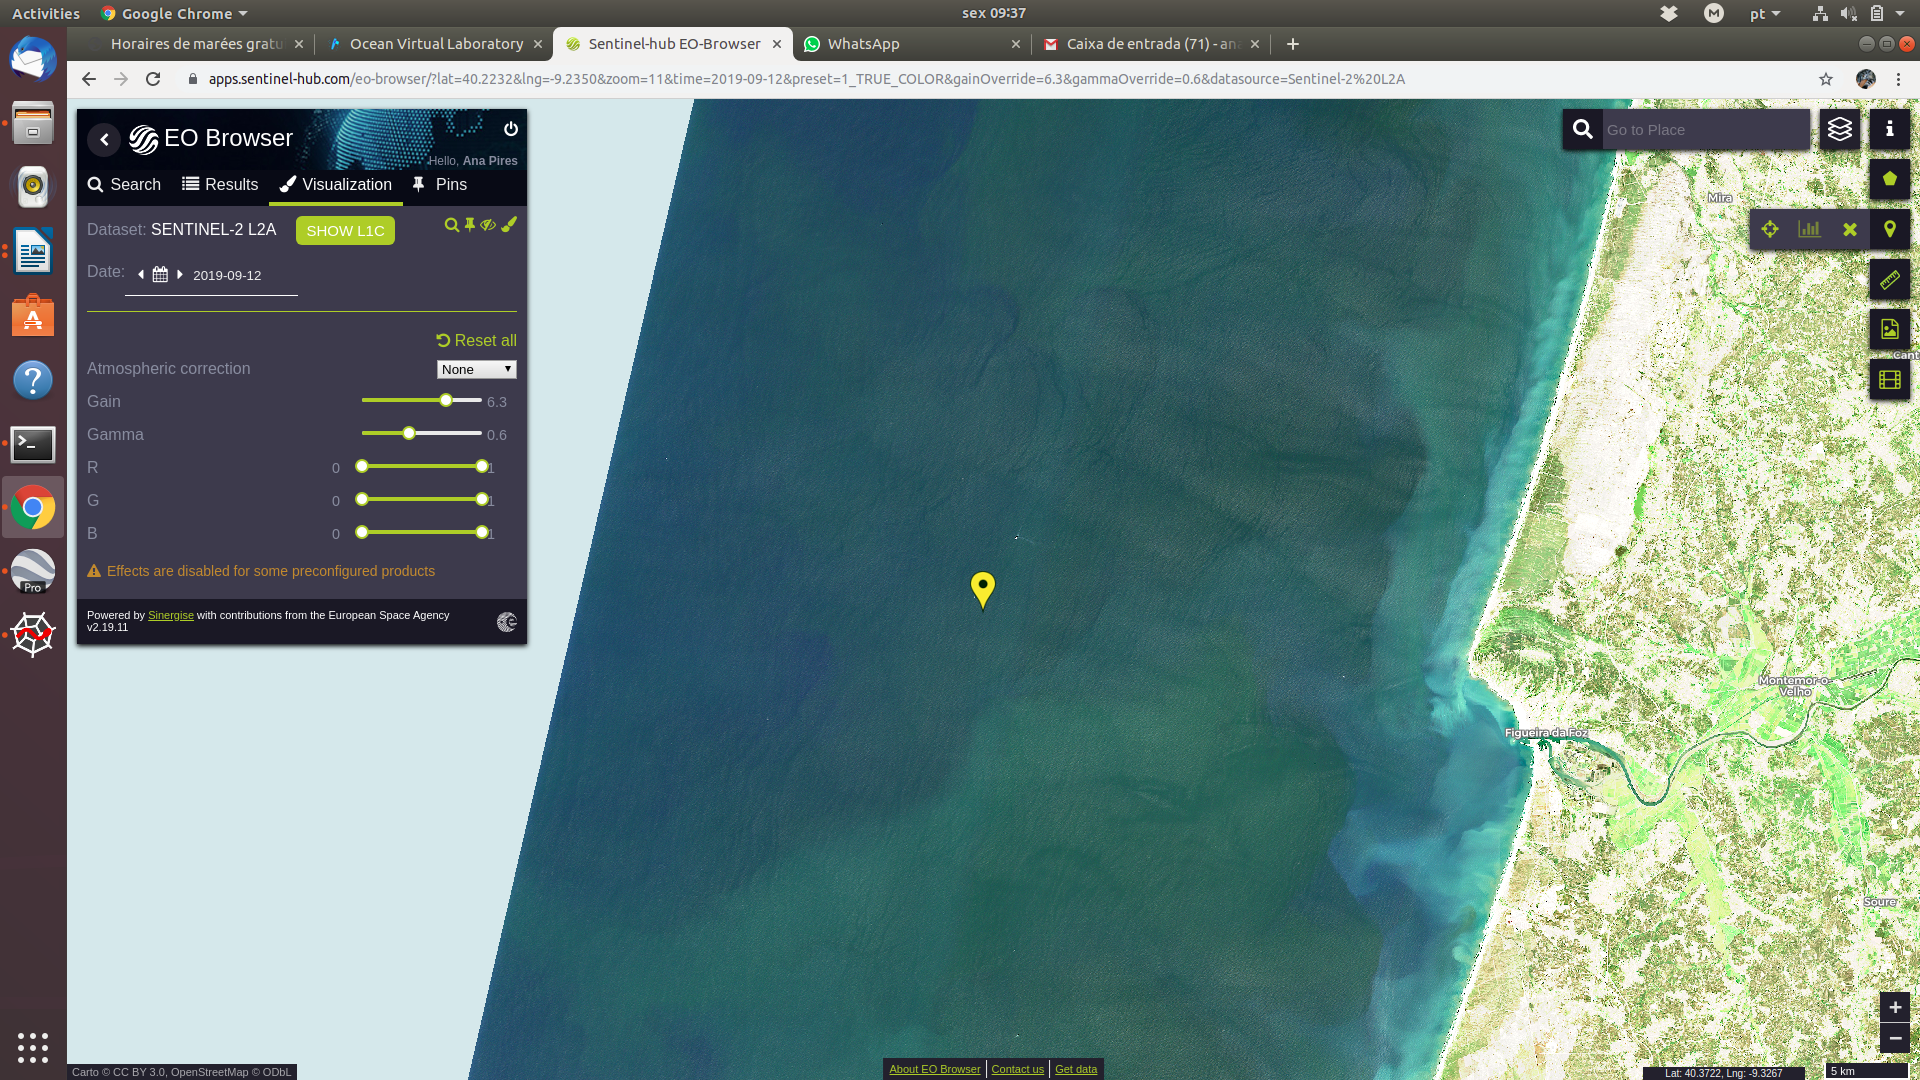
The Sentinel 2 constellation has a multispectral imager (MSI) that allows to some degree the detection of the same ocean surface roughness as SAR. Unlike SAR, the MSI works passively, by collecting sunlight reflected from the Earth. Hence, the overall RGB look of the images.
The premise HabWAVE aims to test is whether internal waves, once they reach decreasing bathymetric values, are responsible for bottom sediment re-suspension episodes strong enough to release G. catenatum cysts (known to rest in sediment bed at down to 100 m depth) onto the water column toward favorable conditions of phytoplankton blooms. That is why internal wave remote detection was important during the preparation and execution of the cruise.
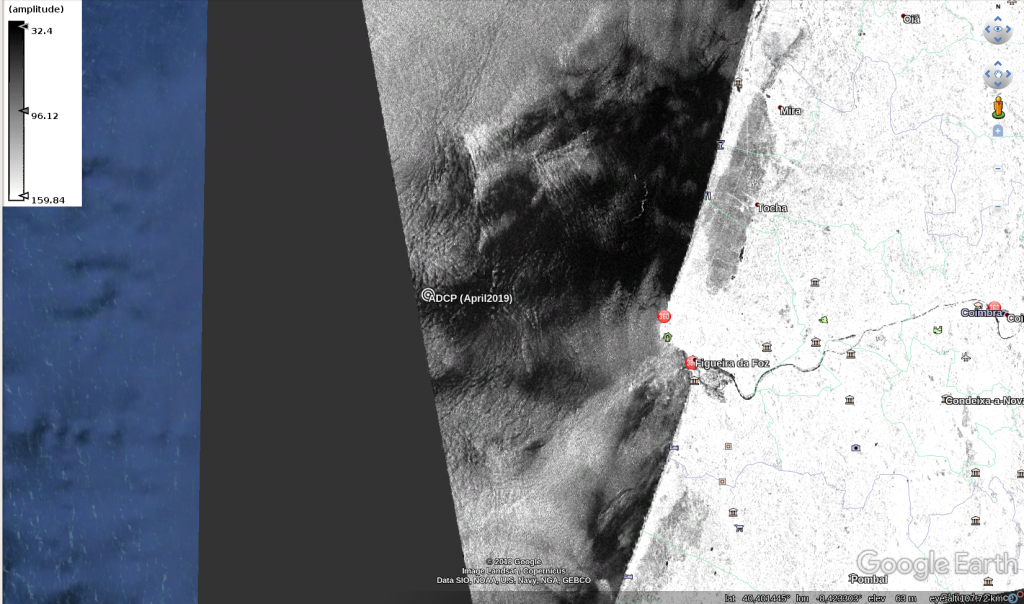
Below are the images off Figueira da Foz between September 6 and 13, with the location of the fixed station (and the ADCP mooring). The most striking feature is the recurrence of internal wave packs separated by roughly the semi-diurnal tidal period. Preferential origin directions are SW and W, but there are also waves coming from the NW.
2019/09/06 06:42 UTC S1A
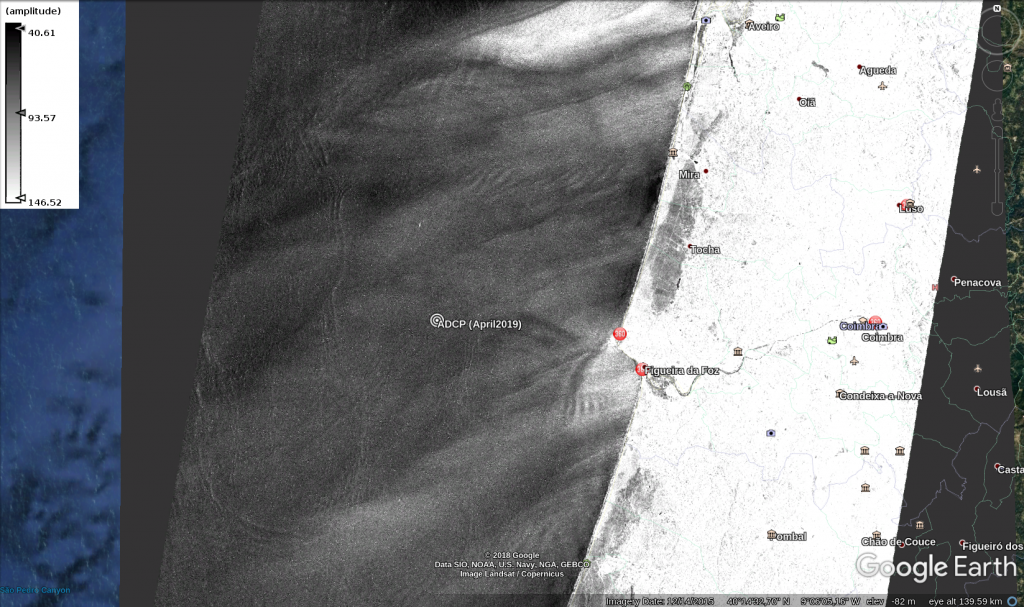
2019/09/06 18:35 UTC S1B
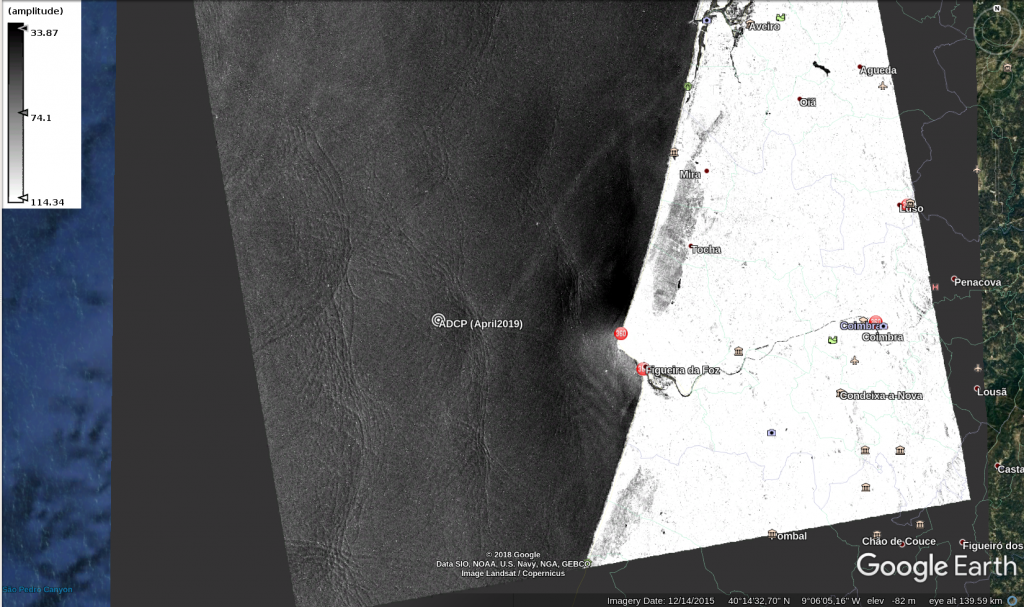
2019/09/07 18:27 UTC S1A
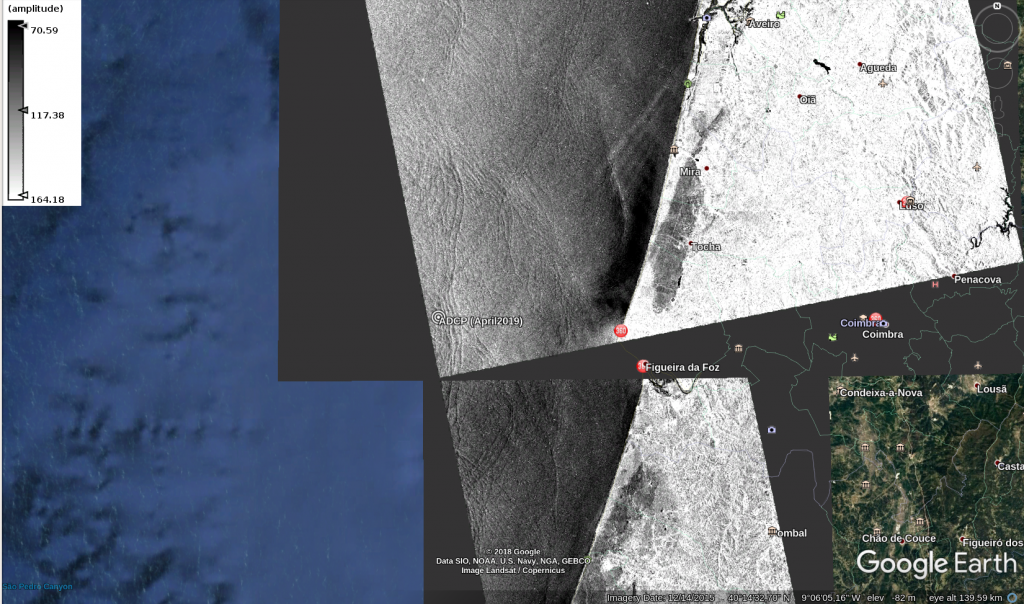
2019/09/12 06:42 UTC S1B
2019/09/12 11:21 UTC S2A (provided by Sentinel Hub Earth Observation)
2019/09/12 18:35 UTC S1A
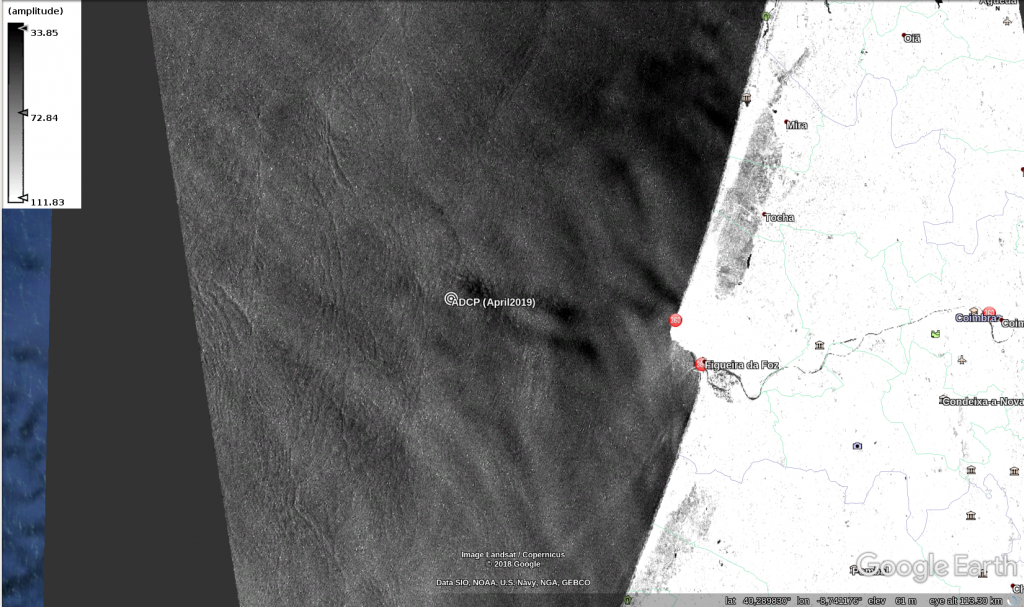
2019/09/13 18:27 UTC S1B